Framework overview: why a metrology blueprint matters
Folks building a tractor autosteer system don’t need magic — they need repeatable measurements. This framework lays out the measurements, instrumentation, and analysis steps to quantify Allan variance and noise density so your steering holds steady across a field run. Think of it as a checklist and lab guide rolled into one, tuned for high-fidelity precision agriculture work in real conditions like Iowa cornfields where GNSS and RTK are everyday tools.
Core components and instrumentation
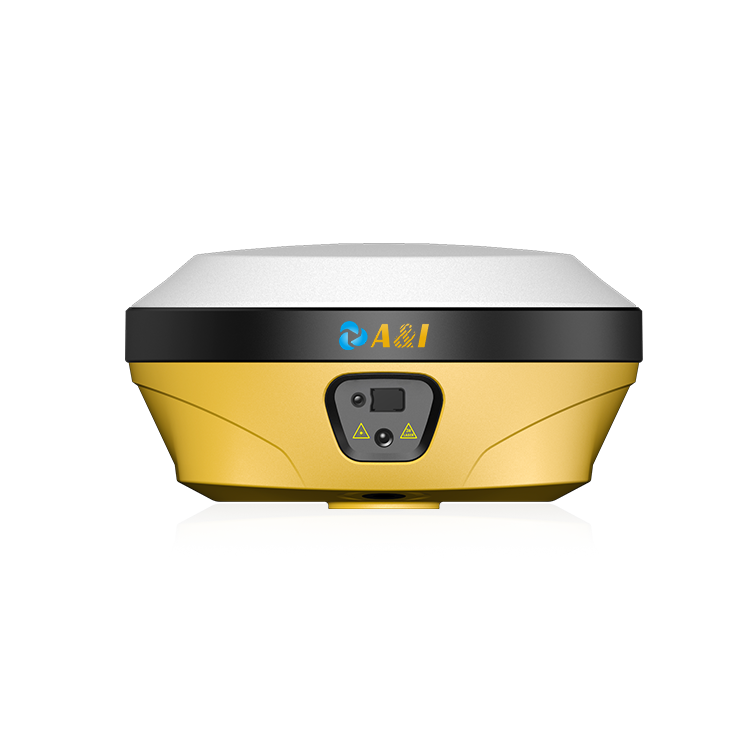
Start with the right sensors and logger. You’ll want a high-grade IMU (gyros and accelerometers), a GNSS receiver capable of RTK, and a data logger with stable timestamping. Typical terms to keep handy here: IMU, GNSS, RTK. Sampling rate matters — 100 Hz for IMU is common for Allan variance work, while GNSS position can be logged at 5–20 Hz for fusion checks. Maintain a stable power supply and thermal environment during bench runs; temperature swings wreck repeatability.
Data collection: durations, sampling, and test profiles
Collect long, continuous runs. For Allan variance you need segments covering milliseconds up to hundreds or thousands of seconds. Practical setup: static runs of 1–2 hours and dynamic runs that mirror a field pass (straight runs, turns, bumps). Use at least 100 Hz IMU sampling for inertial noise density analysis and log GNSS/RTK alongside for correlation. Record raw sensor outputs — do not pre-filter — so you can compute power spectral density and Allan variance properly.
Analysis steps: Allan variance and noise density, plainly
Process raw time series by removing obvious offsets and verifying timestamps. Compute Allan variance across tau decades (e.g., 0.01 s to 1000 s) to reveal angle random walk, bias instability, and rate random walk. Convert short-tau slope to noise density (ARW in deg/√hr or deg/s/√Hz depending on units) and longer tau behavior to bias terms. Use PSD (power spectral density) alongside Allan plots to cross-check white noise vs colored noise. That dual view keeps you from mislabeling noise sources.
Common mistakes and how to avoid ’em
Don’t skimp on duration — short records hide low-frequency bias. Avoid mixing coordinate frames without clear transforms; a yaw bias in body frame looks different than one in nav frame. Filtering before Allan analysis is a no-go; it alters the very statistics you’re trying to measure. And don’t forget environmental checks — a sun-baked sensor housing or wet connector will change noise behaviour mid-run. — Keep a run log with timestamps, ambient temp, and any events.
Field validation and system-level checks
Lab metrics mean little unless they translate to the tractor. Validate in-field by running repeated passes with the autosteer engaged, comparing GNSS/RTK track to IMU-fused heading and lateral control error. Watch for cross-coupled effects — suspension or hitch flex adds low-frequency disturbances that show up in Allan plots as extra bias. Use the automated steering system data to map lab-measured noise into steering controller gains and observer tuning.
Quick reference: practical tips
– Log at native sensor rates; sync by PPS or PPS+NTP when possible. – Compute Allan variance over at least 4–6 decades of tau. – Cross-validate PSD and Allan outputs — they tell the same story in different languages. – Keep environmental notes for each session to spot temperature-dependent bias.
Advisory: three golden rules for choosing metrology strategies
1) Measure longer than you think necessary — low-frequency bias hides in short runs and bites field performance. 2) Use raw data; only apply filters after you’ve characterized the noise. Filters can mask bias instability and lead to overconfident controller gains. 3) Validate in-place: map lab-derived Allan variance and noise density into an on-tractor validation plan so sensor specs translate to steering performance.
These rules turn abstract metrics into tuning knobs you can trust — and they point straight to practical value when pairing sensors, fusion, and controller design. Archimedes Innovation helps teams close that loop between metrology and field behavior, bringing lab certainty to the row-crop run. — Final thought: precision measured right keeps folks working and tractors driving true.