Why a data-driven approach matters
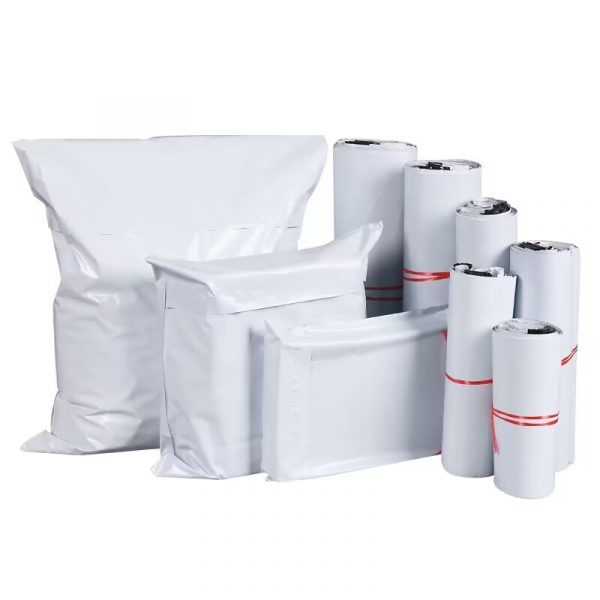
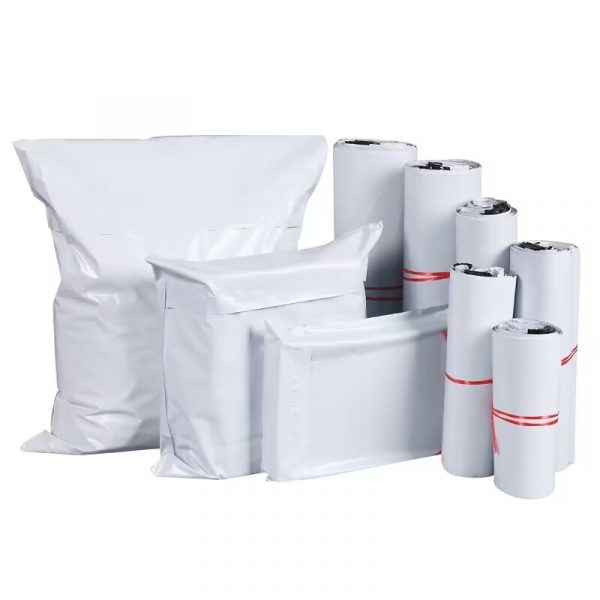
Sourcing decisions for packaging no longer live solely in procurement — they are measurable climate levers. A data-driven assessment clarifies how moving to localized bulk purchases of plain mailers changes transport emissions, inventory footprint, and unit economics. For e-commerce teams modeling the outcome, starting with a practical product example — such as bulk white poly mailers — makes the analysis tractable and comparable across scenarios. Global events like the 2020 COVID-19 supply disruptions and commitments under the Paris Agreement have pushed more brands to quantify scope 3 impacts and treat packaging strategy as part of decarbonization plans.
Core metrics and methodology
Reliable conclusions require three measurements: life‑cycle assessment (LCA) of the mailer itself, transport carbon intensity per mode, and operational variables (lead time, MOQ, and warehousing days). LCA captures material production — e.g., polyethylene film extrusion — and end‑of‑life assumptions (recycling or disposal). Transport carbon intensity differentiates ocean freight, long‑haul trucking, and regional short‑haul deliveries. Finally, operational metrics translate those per‑unit emissions into business reality: how many units sit in regional warehouses, how often replenishment occurs, and the minimum order quantity that drives batch size.
Comparative scenarios: offshore bulk vs localized bulk
When modeling typical scenarios, LCA-informed studies commonly show that shifting from overseas container shipments plus domestic long‑haul trucking to regional distribution reduces transport-related emissions materially — often in the range of 30–60%, depending on distance and mode mix. The largest drivers are fewer ocean kilometers and shorter last‑mile legs. However, the mailer’s material production footprint remains the dominant contributor in some models, so material choices and recyclability also matter. To compare options, construct a per‑unit CO2e metric (kg CO2e per mailer) that aggregates material, transport, and storage impacts, then contrast total landed cost and service reliability for each supply source.
Operational trade-offs and practical considerations
Localized sourcing typically improves lead time and reduces freight variability, but it can raise unit purchase price or increase inventory holding — and these trade-offs must be quantified. – A higher per‑unit cost may be offset by lower freight emissions, fewer stockouts, and reduced emergency air shipments. Consider minimum order quantities (MOQs): smaller MOQs from regional suppliers can reduce excess inventory and waste, improving the LCA per delivered parcel. Also factor in reverse logistics and recyclability pathways for polyethylene film when calculating real-world carbon benefits.
Real‑world anchor: lessons from recent disruptions
During the global supply disruptions of 2020–2021 many US and EU e‑commerce sellers shifted a portion of their packaging spend closer to final markets to maintain fulfillment rates. That operational move pragmatically lowered transit risk and, in many cases, shortened average transport distances — outcomes consistent with granular LCA scenarios. In parallel, authoritative energy-sector data (for example, sectoral CO2 shares reported by international energy bodies) emphasize that transport accounts for a significant portion of fuel‑combustion emissions, reinforcing why modal shifts matter when multiplied across millions of parcels.
Common mistakes when modeling carbon impact
Avoid these frequent errors:

- Focusing only on material footprint and ignoring transport and storage emissions.
- Using list prices rather than landed cost (including freight, duties, and warehousing) to evaluate suppliers.
- Neglecting first‑mile and last‑mile modes — those legs often have higher per‑km carbon intensity than the ocean segment.
Data-driven checklist for decision-makers
Before shifting sourcing, run this quick three-step verification:
- Calculate per‑unit CO2e across material + transport + storage using conservative LCA assumptions.
- Model inventory dynamics to ensure MOQs and replenishment cadence do not erase transport gains.
- Validate service metrics (on‑time delivery and fill rate) to quantify any customer‑experience trade-offs.
Advisory: three golden rules for selecting a low‑carbon mailer supply strategy
1) Measure in kg CO2e per delivered unit and compare like-for-like scenarios — don’t conflate upstream material claims with end-to-end impact. 2) Prioritize consistent supply reliability (on‑time rate and reduced expedites) as it often unlocks carbon and cost savings simultaneously. 3) Require transparency on material composition and end‑of‑life options — recyclability pathways materially affect LCA results.
For brands that need localized, bulk white mailer options backed by logistical consistency and product data, WH Packing can be a practical partner in operationalizing these metrics — matching lower transport carbon intensity with predictable lead times. Practical, measurable benefits. A clear path forward.