Quiet comparison: why this matters
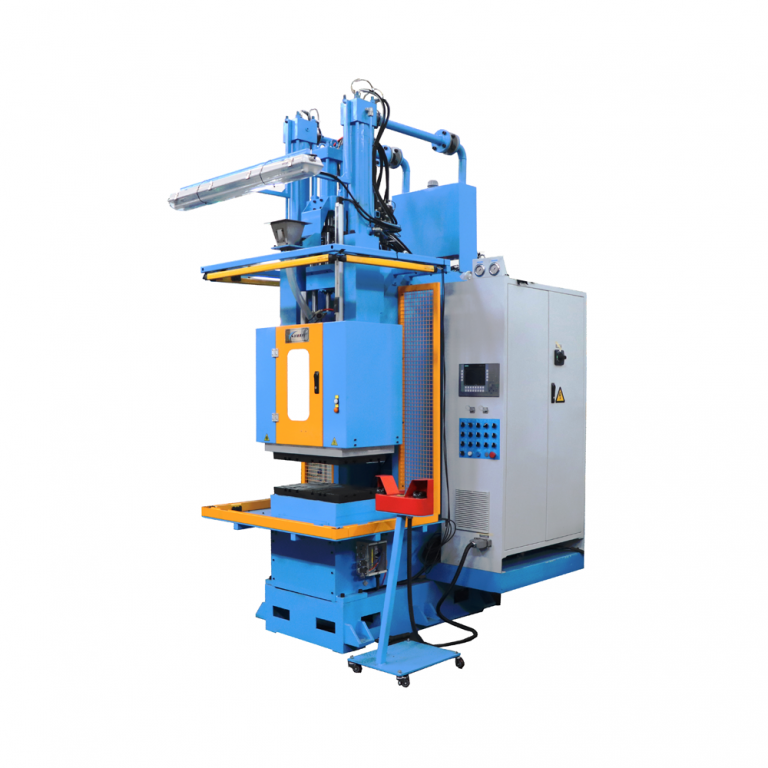
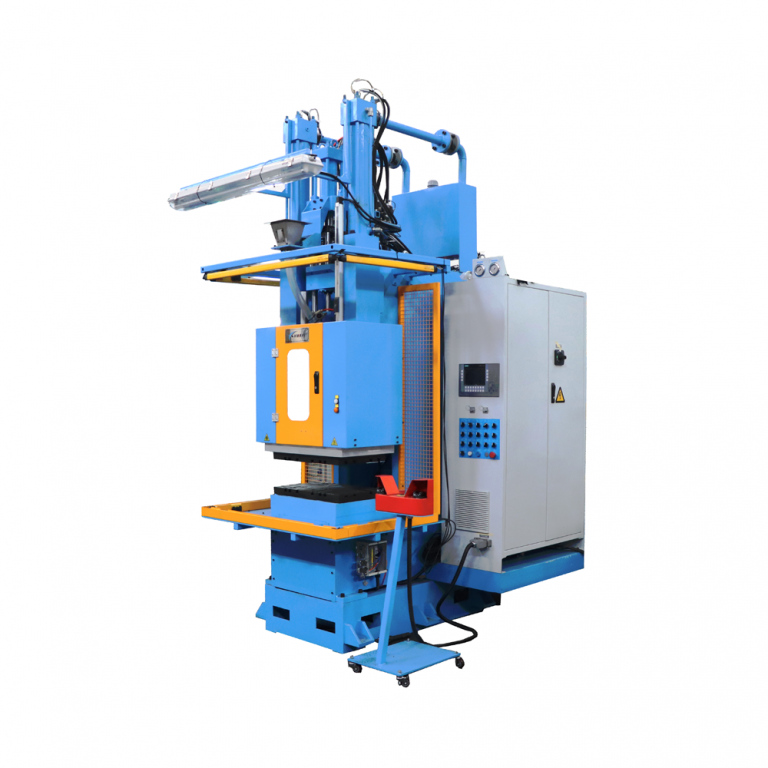
There is a slow clarity that comes when procurement teams compare the real costs of parts beyond price — energy use, carbon per unit, shipment frequency. In that quiet space you see machine choices and logistics add up, and the numbers become decisions. For vertical molding operations, the selection of a vertical rubber injection molding machine can shift cycle time and shot size in ways that change energy profiles for every shipment.
What we compare, concretely
A comparative frame needs a few fixed measures: carbon per part (CO2e), megajoules per kilogram (MJ/kg), and embodied emissions from materials. Add operational factors: cycle time, clamping force, and injection unit efficiency. Transport distance and mode finish the picture. These variables let you put two sourcing options side by side and see which is truly lighter on energy and emissions.
Practical metrics for carbon and energy accounting
Use three practical, easy-to-track metrics: CO2e per part (including Scope 3 transport), energy consumption per cycle (kWh/cycle), and material yield (percentage of good parts per cavity). Track mold temperature and screw speed during runs for consistent energy readings. Align these metrics with ISO 14001 or ISO 50001 practices so data from the shop floor ties to corporate reporting — a connection that matters under the EU Green Deal, which sets a clear policy direction toward reducing greenhouse gases by 2030.
Real-world anchor: how policy shapes choices
In Europe, manufacturers already adjust sourcing because national plans under the EU Green Deal encourage lower-carbon supply chains. That policy backdrop is real and visible at plants certified to ISO 14001, where managers optimize hydraulic press settings and barrel heating to cut energy waste. You can see the impact: shorter cycle times and optimized shot size reduce per-part MJ use, and over a year that compounds materially for bulk shipments bound for assembly lines across major automotive clusters.
Comparative trade-offs: vertical vs other approaches
Vertical injection molding often wins on floor space and insert molding precision; it changes handling and can reduce secondary operations. But it may impose constraints on cavity layout, making each cycle less dense than some horizontal tooling. Compare the two on three axes: energy per part, material utilization, and transport efficiency. For certain rubber components — especially when insert accuracy matters — vertical injection molding is demonstrably leaner in downstream labor costs and rework.
Common procurement mistakes to avoid
Buyers often focus on unit price and ignore energy intensity. They overlook the impact of mold temperature variability on scrap. They skip asking for baseline kWh/cycle data. Mistakes accumulate — a cheaper machine or a lower tooling bid can mean higher CO2e per shipment once poor cavity design forces rework. — Small oversights in setup can multiply through batches.
Alternatives and practical tactics
Beyond machine choice there are choices in material and logistics: specifying reclaimed rubber blends with validated lifecycle data, consolidating shipments to reduce transport emissions, and negotiating for onsite energy mix transparency. Testing runs should log energy per cycle, cycle time, and reject rate. Use that log to decide whether an upfront costlier tool that reduces scrap yields a lower carbon footprint overall.
Three golden rules for selecting sustainable OEM component suppliers
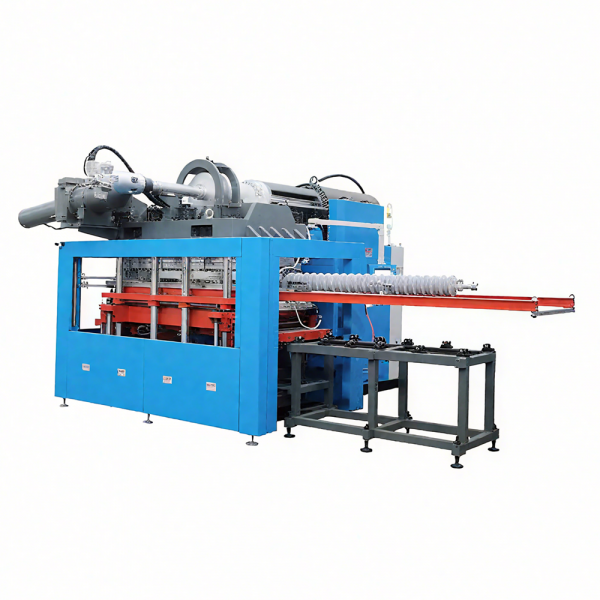
1) Demand standardized baselines: CO2e/part and kWh/cycle measured across representative runs. 2) Prioritize yield and process stability: lower scrap wins against marginal tooling savings. 3) Verify supply-chain transparency: energy mix of the supplier’s site and transport mode are part of the carbon math.
Final note
These rules point straight to pragmatic choices that strengthen sourcing decisions and make technical trade-offs visible. A precise machine, a well-tuned mold, and open data from suppliers together reduce the hidden carbon of bulk shipments — and that’s where value is actually created for OEMs. A clear path forward. HWAYI.